")
Your local coffee shop probably sells more cappuccinos on rainy Monday mornings than on sunny Fridays. That's not a coincidence and a smart café owner who tracks that pattern will never run out of milk on the wrong day. That, in the simplest possible terms, is data analytics. Finding patterns in information, and using them to make smarter decisions.
No PhD required. No supercomputer. Just the right questions and the willingness to look at your numbers.
This guide explains what data analytics actually is, why it matters for businesses of every size, and most importantly what it looks like in the real world. By the end, you'll have a clear picture of how data analytics works, and you'll probably start seeing it everywhere.
So, What Exactly Is Data Analytics?
Data analytics is the process of examining raw data to find useful information and draw conclusions from it.
Raw data on its own is useless. A spreadsheet with 10,000 rows of sales numbers tells you nothing by itself. Data analytics is what turns that mess of numbers into something you can actually act on like "we sell 3x more of Product A on weekends" or "customers who buy Item X almost always come back within 30 days."
Think of raw data as a box of puzzle pieces. Data analytics is the process of sorting, examining, and connecting those pieces until a picture starts to emerge. Sometimes the picture surprises you. Often, it confirms what your gut already suspected but now you have proof.
Here's what makes it genuinely useful: decisions made with data tend to be better than decisions made on gut feeling alone. That's not a dig at intuition it's just that data catches things humans miss, especially when the numbers are large or spread across time.
A Real Example: The Corner Bakery
Let's say you run a small bakery. Every day you bake 40 croissants, but you often throw away 10 to 15 unsold ones at closing time. You've been doing this for two years. The waste adds up.
A data analyst would look at your sales records which days sell out, which days don't, what the weather was like, whether there was a local event nearby and spot the pattern. Maybe you consistently sell out on Tuesday and Wednesday but always have leftovers on Sunday afternoons. Now you know: bake 50 on Tuesdays, 30 on Sundays. Less waste. More profit. Same oven.
That's data analytics in action. No machine learning required. No fancy software. Just careful observation of the data you already have.
The Four Types of Data Analytics (Explained Simply)
Most textbooks present four types of data analytics, and honestly, the names are a bit dull. But the concepts are useful once you understand what each one actually does.
Descriptive analytics answers the question: what happened? It's the most basic type summarizing past data. Sales reports, monthly revenue totals, website traffic numbers. Any time you're looking at a dashboard showing you what occurred in the past, that's descriptive analytics. It's where most businesses start, and there's nothing wrong with it.
Diagnostic analytics goes one step further and asks: why did it happen? If your sales dropped 20% last month, diagnostic analytics helps you figure out why. Was it a pricing change? A product going out of stock? A competitor running a promotion? It's the detective work of data.
Predictive analytics looks forward: what is likely to happen? This is where things get interesting. By spotting patterns in past data, you can make educated guesses about the future. Netflix uses this to predict which shows you'll enjoy next. Banks use it to estimate whether someone is likely to repay a loan. Your email app uses it to guess which messages are spam before you even see them.
Prescriptive analytics is the most advanced it not only predicts what will happen, but recommends what you should do about it. GPS apps are a great example. They don't just tell you there's traffic ahead they reroute you in real time and prescribe the fastest path.
Most small businesses spend most of their time in descriptive and diagnostic territory. That's completely fine. The value is there, even without the fancy stuff.
Why Does Data Analytics Matter Right Now?
Here's the honest answer: because more data exists now than ever before, and ignoring it puts you at a disadvantage.
Every time someone visits your website, buys something from your store, opens your email, or scrolls past your ad that's a data point. Individually, each one is meaningless. Together, they tell a story about what's working and what isn't.
Organizations that treat data seriously are no longer just running reports on last quarter's performance they're using their data to forecast next quarter's metrics and even recommend actions to improve them. That's a meaningful shift. The businesses still running on monthly gut-check meetings are competing against businesses that know their numbers every morning.
There's also a career angle here that's worth being honest about. An analyst who combines SQL for data extraction, Python for data wrangling, and a BI tool for visualization is considered highly valuable across industries right now. If you're learning data analytics as a skill, you're entering a field with genuine, sustained demand — not just hype.
What Does a Data Analyst Actually Do All Day?
This is one of those questions where the job title and the job description often don't match. Here's a more realistic picture.
A data analyst spends a lot of time probably more than you'd expect cleaning data. Real-world data is messy. Spreadsheets have typos. Databases have duplicate entries. Exports from different systems don't line up. Before any real analysis can happen, someone has to make the data usable. That unglamorous step is probably 40–60% of the actual job.
Then comes the analysis itself: writing queries to pull the right information, building charts and dashboards that make the findings easy to understand, and writing up a summary that a non-technical manager can actually read without their eyes glazing over.
The last part communicating findings clearly is underrated as a skill. Being able to run a perfect SQL query means nothing if you can't explain what it means to the person making the business decision. The best data analysts are translators as much as they are technicians.
Here's something that often surprises people: you don't need to know advanced mathematics to be a good data analyst. You need a solid grip on averages, percentages, and basic statistics. Beyond that, it's mostly logic and curiosity. Can you ask the right question? Can you spot when a number looks wrong? Can you explain your finding clearly? Those skills matter far more than knowing calculus.
Data Analytics in the Real World: Industry Examples
It helps to see data analytics working in familiar contexts. Here are a few concrete examples across different industries.
Retail
A clothing brand notices that customers who buy jeans almost always look at belts next. The analytics team spots this pattern in purchase data and adds a "frequently bought together" prompt on the product page. Conversion rate on belts goes up by 22%. That's pure diagnostic and predictive analytics driving revenue.
Healthcare
A hospital system analyzes patient data and notices that certain combinations of symptoms in emergency room patients are strong predictors of a serious condition that often gets missed on first examination. They build an alert system around this pattern. Outcomes improve. AI algorithms are now enhancing diagnostic accuracy in healthcare analyzing medical imaging and helping detect subtle patterns that are easy to overlook.
Small business
A freelance graphic designer tracks where her clients come from. After six months of logging every inquiry, she realizes that 70% of her paying clients came from one specific referral source a local networking event she attends quarterly. She starts attending monthly instead. Her revenue grows without spending a single dollar on advertising.
Sports
Football clubs now analyze player movement data from tracking sensors worn during training sessions. They use this to manage player fatigue, reduce injury risk, and identify which tactical formations work best against specific opponents. Data analytics is shaping decisions in shopping apps, hospitals, sports teams, and even city planning.
The common thread? None of these teams waited for something to go wrong. They used data to find opportunities they would have otherwise missed entirely.
The Tools Data Analysts Use (An Honest Overview)
You don't need to learn all of these at once. But it's useful to know what exists.
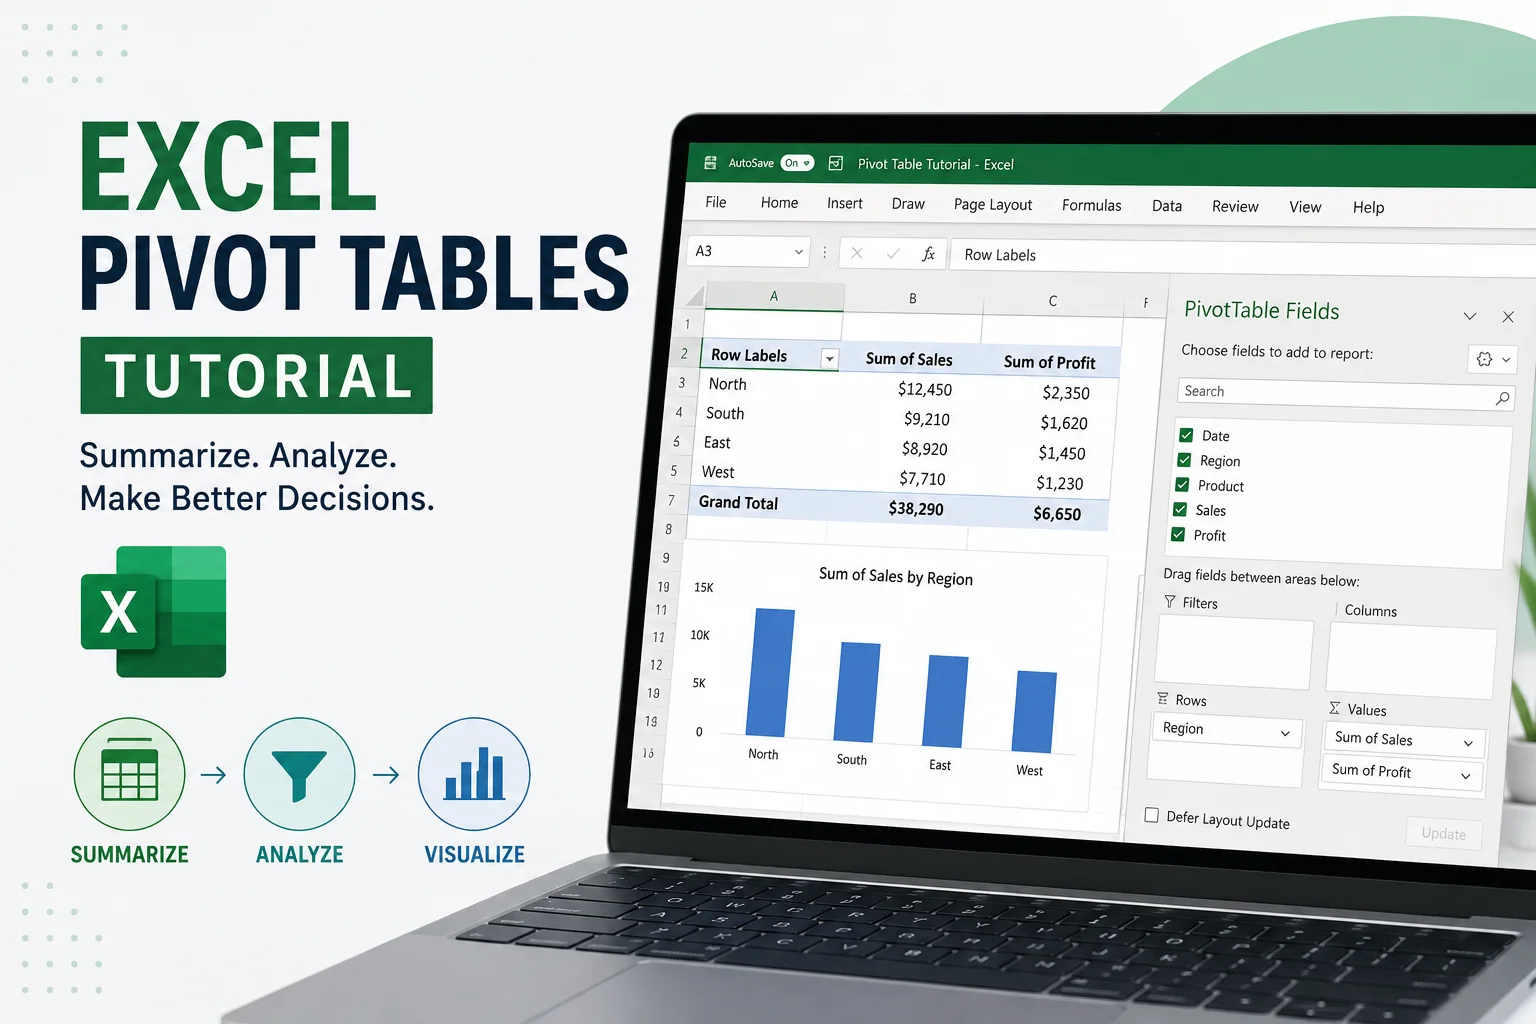
Excel and Google Sheets are where most beginners start, and honestly, most small business owners never need to go further. Pivot tables alone can answer a huge percentage of everyday business questions.
SQL (pronounced "sequel" or "S-Q-L" — both are fine) is the language used to talk to databases. If Excel is a calculator, SQL is the key to the filing cabinet where all the data lives. It's the single most in-demand skill for data analyst jobs, and it's not as complicated as it sounds. You can learn enough SQL to be genuinely useful in a few weeks.
Python with Pandas is the next step up. Python is a programming language, and Pandas is a library that makes it great for data work. This is where things get powerful — you can automate repetitive tasks, handle massive datasets, and do statistical analysis that Excel can't manage.
Power BI and Tableau are visualization tools. They connect to your data and help you build dashboards — the charts and graphs that make your findings easy for others to understand. Power BI is Microsoft's product and tends to be popular in corporate environments. Tableau is preferred by many in the US and Europe for its visual polish.
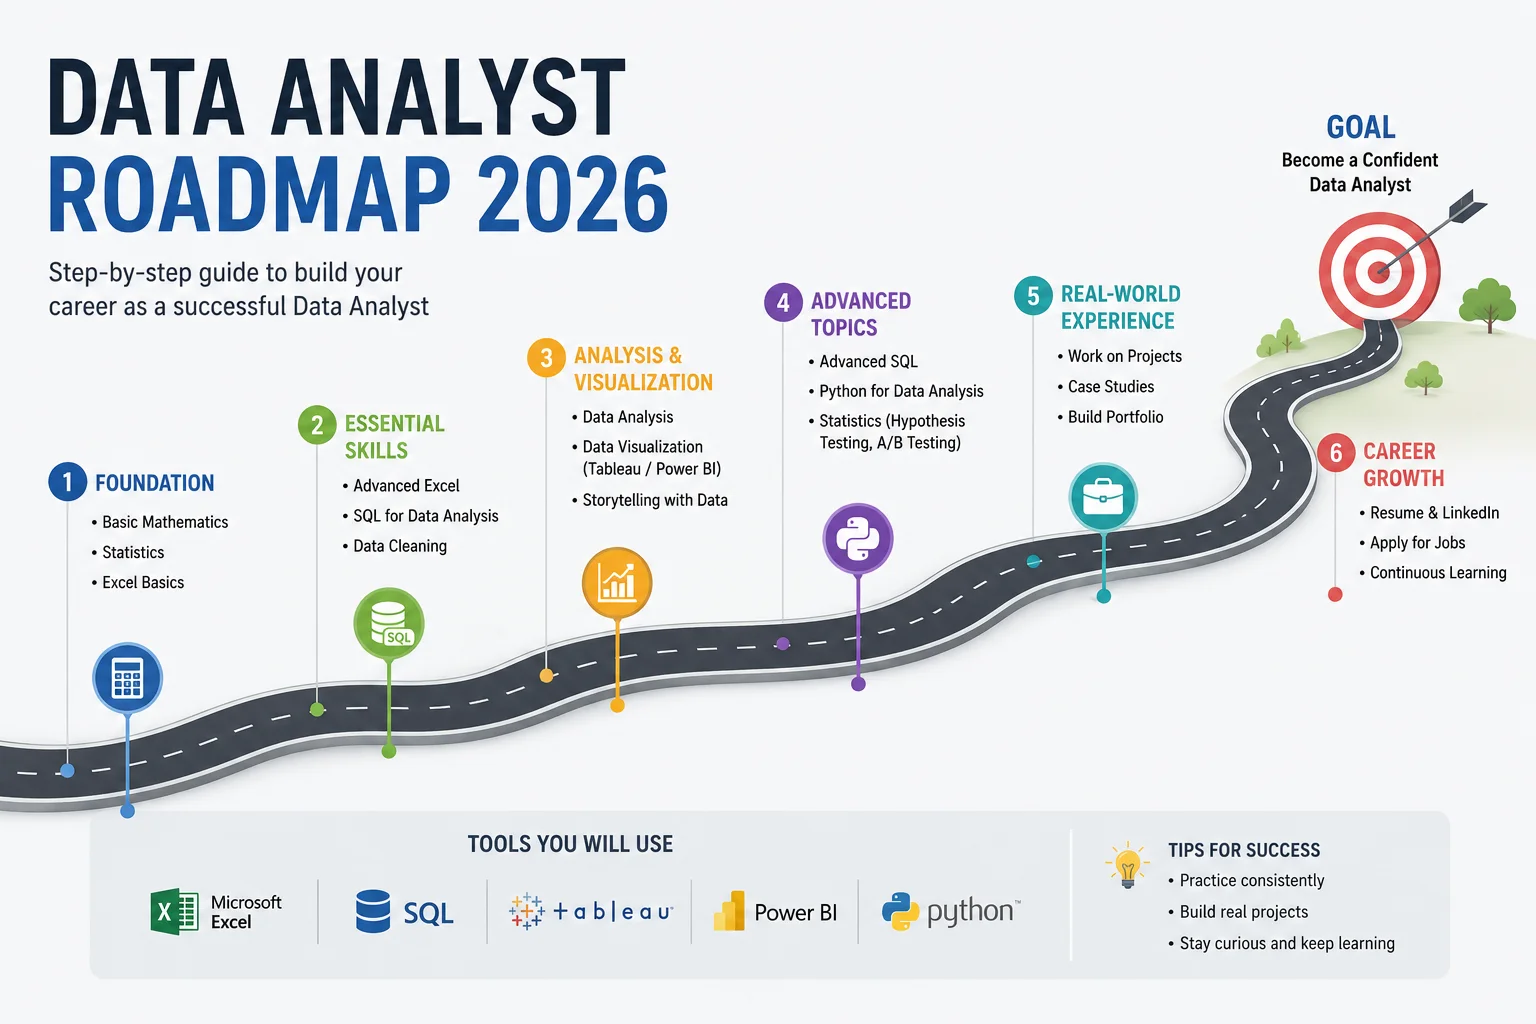
If you're starting from scratch, the recommended order is: Excel → SQL → Python → visualization tools. Recommended starting stack for beginners: MySQL → Excel → Power BI → Python (Pandas), in that order. Master this combination and you'll be competitive for the vast majority of entry-level data analyst openings.
Common Misconceptions About Data Analytics
"You need to be a math expert." You don't. You need to be comfortable with numbers and logical thinking. The heavy mathematical work is done by the tools. What you provide is the judgment.
"It's only for big companies." This one is genuinely wrong, and it's costing small businesses money every day. If you have more than six months of sales data, you have enough to start finding patterns. A small café, a freelance agency, a single retail store all of them can benefit from even basic data analysis.
"It's all about prediction." Plenty of valuable analytics is simply descriptive. Knowing that 60% of your customers are between 25 and 34 years old is useful even if you never predict anything from it. Understanding what's happening is valuable on its own.
"You need expensive software." The most powerful tools Python, SQL, Google Sheets are free. Power BI has a free desktop version. You can build a surprisingly capable analytics setup without spending anything.
How Is Data Analytics Different from Data Science?
People use these terms interchangeably and they're really not the same thing.
Data analytics focuses on examining existing data to answer specific business questions. It's grounded, practical, and usually works with structured data rows and columns you can put in a spreadsheet.
Data science is broader and more research-oriented. Data scientists build predictive models, work with unstructured data like images and text, and often venture into machine learning and AI territory. The job requires more mathematical depth and programming skill.
Think of it this way: a data analyst is more like a detective examining evidence. A data scientist is more like a researcher designing experiments and building new tools. Both are valuable. The analyst role is generally more accessible as an entry point.
If you're just starting out, data analytics is the right place to begin. Many data scientists started as data analysts and moved into more technical territory over time.
Where Do You Start?
Here's the honest, practical answer: start with the data you already have.
If you run a business, look at your sales records. If you're a student, find a free dataset on Kaggle (a platform with thousands of publicly available datasets) and just explore it. What's the average? What's the highest number? What's the lowest? Are there any obvious patterns?
You don't need to install anything special to begin. Open Google Sheets. Load a CSV file. Start asking questions of your data. The habit of curiosity of looking at numbers and wondering why is the foundation of every data analyst skill that comes after it.
The rest the SQL, the Python, the dashboards is all just tooling. The thinking comes first.
What's Next?
This guide gave you the foundation: what data analytics is, how it works across different types, and where it shows up in the real world. Now the next question is where to take it.
If you want to build a practical skill you can use right now whether for a job or your own business the best next step is getting comfortable with Excel's most powerful features. Pivot tables and data cleaning in Excel will unlock more insight than most people realize, and you can learn both in a weekend.
After that, SQL. Then Python. One step at a time.
The entire series on this site is built to walk you through that path — no fluff, no jargon, just practical skills with real datasets. Start with the Excel pivot tables tutorial next, or if you want the full roadmap first, the data analyst roadmap for beginners maps out the whole journey.
Citations:
Refonte Learning — Data Analytics in 2026: https://www.refontelearning.com/blog/data-analytics-in-2026-trends-tools-and-career-opportunities
GROWAI — Data Analytics Skills for Freshers: https://growai.in/data-analytics-skills-that-every-fresher-must-have-in-2026/
Coherent Solutions — Future of Data Analytics Across Industries: https://www.coherentsolutions.com/insights/the-future-and-current-trends-in-data-analytics-across-industries
Analytics Insight — Data Analytics Projects 2026: https://www.analyticsinsight.net/data-analytics/data-analytics-projects-of-2026-top-10-ideas-to-explore
Related Posts:
https://artificialintelligenceherald.com/ai/openclaw-the-complete-guide-setup-features-costs-use-cases-security
https://artificialintelligenceherald.com/news/ai-agents-business-automation-guide