You've got mountains of data. Now what? Most businesses collect data obsessively but struggle to actually use it. The reason, more often than not, is that they're applying the wrong type of analytics to the wrong problem like using a hammer to tighten a screw.
There are four types of data analytics, and each one answers a fundamentally different question. Master the difference, and you'll know exactly which tool to reach for and when.
The Four Types at a Glance
Before breaking each one down, here's the simplest way to remember them:
Descriptive analytics answers: What happened?
Diagnostic analytics answers: Why did it happen?
Predictive analytics answers: What will happen?
Prescriptive analytics answers: What should we do about it?
They build on each other. You can't meaningfully predict what's coming if you haven't first understood what happened and why. Think of them as four floors of a building each one requires the one below it.
1. Descriptive Analytics "What Happened?"
Descriptive analytics is the foundation. It takes raw historical data and turns it into something a human being can actually interpret — charts, dashboards, summary reports, KPIs. If you've ever looked at a monthly sales report, a Google Analytics dashboard, or a year-over-year revenue chart, you've consumed descriptive analytics.
It doesn't explain why anything happened or predict what's coming. It just tells the story of the past with clarity.
Real business example: A retail chain like Target reviews weekly sales data broken down by store, region, and product category. The report shows that Store #47 in Dallas had a 22% drop in foot traffic during the third week of November. That's descriptive analytics — pure observation, no interpretation yet.
Another common application: a marketing team tracks email campaign metrics — open rates, click-through rates, unsubscribes — after every send. The numbers are right there. Something went up or down. But why is a question for the next layer.
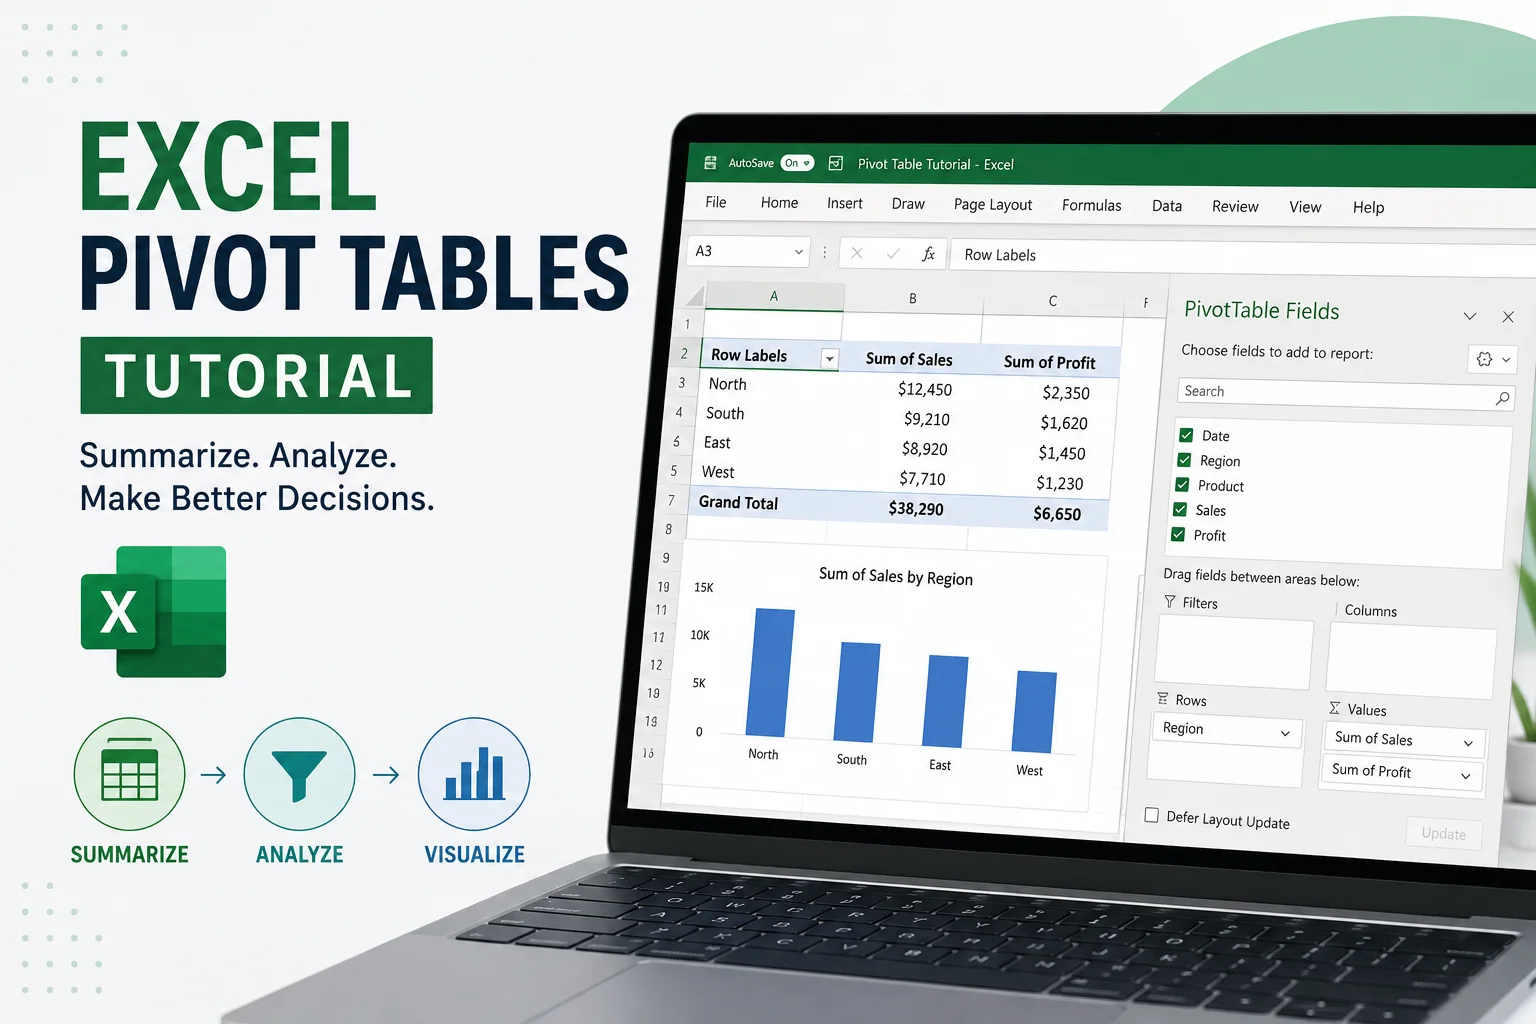
The tools here are familiar: Excel pivot tables, Tableau dashboards, Power BI reports, Google Data Studio. Most business intelligence (BI) tools are built primarily for descriptive analytics.
Here's the catch: a lot of companies stop here. They build beautiful dashboards and feel like they're being data-driven. But descriptive analytics alone is like reading the weather history and calling yourself a meteorologist. It's a starting point, not an endpoint.
2. Diagnostic Analytics — "Why Did It Happen?"
Once you know what happened, the natural next question is why. That's where diagnostic analytics comes in. It goes deeper into the data — drilling down, filtering, cross-referencing different datasets — to identify the root cause of a particular outcome.
This is where data analysis starts feeling more like detective work.
Real business example: Going back to that Target store in Dallas with the 22% foot traffic drop. Diagnostic analytics might reveal the drop correlates with a competing store opening three miles away, combined with a pricing error on a high-traffic product category. Neither insight is obvious from the top-line number alone — you have to dig.
Netflix does this constantly. When a show underperforms, their analytics teams don't just note the low viewership; they examine watch completion rates by episode, drop-off points, demographic segments, and regional performance to understand where interest died and why. That's diagnostic work at scale.
Techniques involved here include data drilling, correlation analysis, and root cause analysis. Tools like SQL queries, Python with pandas, and BI platforms with drill-down capabilities are workhorses for this type of analysis.
One honest limitation: diagnostic analytics can surface correlations that look like causation but aren't. Two variables moving together doesn't mean one caused the other. Good analysts know to treat diagnostic findings as hypotheses to test, not conclusions to act on blindly.
3. Predictive Analytics — "What Will Happen?"
Now things get more sophisticated. Predictive analytics uses historical data patterns — combined with statistical models and machine learning algorithms — to forecast future outcomes. The key word is probability. It doesn't tell you what will happen with certainty; it tells you what's likely to happen based on patterns.
This is where data science starts earning its keep.
Real business example: Amazon's demand forecasting is one of the most cited examples in the industry. Before a major sales event like Prime Day, Amazon's models analyze years of purchasing history, seasonal patterns, regional demand signals, and even social media trends to predict how much of each product to stock in which warehouse. Get it wrong and you're either sitting on unsold inventory or disappointing customers with out-of-stock errors.
A more grounded example: a SaaS company analyzes customer behavior data — login frequency, feature usage, support ticket volume — to build a churn prediction model. When a customer's behavior starts matching the pattern of accounts that historically churned within 90 days, the model flags them. The customer success team then gets a prioritized list of at-risk accounts every Monday morning.
Banks use predictive analytics for credit scoring — essentially asking, "based on this person's financial history and behavior, how likely are they to default on a loan?" The FICO score most of us live with is, at its core, a predictive analytics output.
Tools in this space include Python's scikit-learn library, R, IBM SPSS, SAS, and cloud-based ML platforms from AWS, Google, and Azure. The models range from relatively simple logistic regression to deep neural networks, depending on complexity.
Worth saying plainly: predictive models are only as good as the data they're trained on. Feed a model biased or incomplete historical data, and you'll get biased, incomplete predictions — confidently delivered.
4. Prescriptive Analytics — "What Should We Do?"
This is the top floor — and the hardest to get right. Prescriptive analytics doesn't just forecast what might happen; it recommends specific actions to take in response. It combines predictive models with optimization algorithms, business rules, and sometimes simulation to suggest the best course of action given your constraints and objectives.
If predictive analytics tells you a storm is coming, prescriptive analytics tells you exactly which umbrella to buy, when to buy it, and how much to spend.
Real business example: UPS's ORION (On-Road Integrated Optimization and Navigation) system is a landmark case. ORION analyzes over 250 million address data points and uses prescriptive analytics to calculate optimized delivery routes for its drivers — accounting for package priority, traffic patterns, fuel efficiency, and delivery time windows. The system saves UPS an estimated 100 million miles driven per year. That's not just a prediction about traffic; it's a specific, optimized recommendation for each driver on each day.
In healthcare, prescriptive analytics is used to recommend personalized treatment plans. IBM Watson Health (in its heyday) attempted to synthesize patient records, clinical trial data, and treatment outcomes to prescribe oncology treatment paths — essentially asking, "given everything we know about this patient and this disease, what treatment sequence has the best probability of success?"
Revenue management in the airline industry is another clean example. When you refresh a flight booking page and the price changes, that's not random. Prescriptive analytics models are continuously adjusting seat prices based on remaining inventory, booking velocity, competitive pricing, and projected demand to maximize total revenue across the flight.
Prescriptive analytics typically involves linear programming, integer optimization, simulation models, and increasingly, reinforcement learning. It's computationally expensive and requires tight integration with operational systems — which is why it's still the least widely adopted of the four types, even though it offers the highest potential payoff.
How the Four Types Work Together — A Single Business Story
The best way to see how these four types connect is to follow one business problem from start to finish.
Imagine a mid-size e-commerce company noticing declining profitability.
Descriptive analytics reveals that average order value dropped 18% over the last two quarters, and the discount rate on orders increased from 12% to 27%.
Diagnostic analytics digs deeper and finds the discount spike correlates with an aggressive promotional strategy launched in Q2, and that customers acquired through heavy discount campaigns have a 40% lower repeat purchase rate than organically acquired customers.
Predictive analytics models project that if the current discount strategy continues, customer lifetime value will decline by an estimated 31% over the next 18 months, and profitability will turn negative within 12 months.
Prescriptive analytics recommends a specific rebalancing: reduce blanket discount campaigns, increase loyalty-based discounts for customers with 3+ purchases, and reallocate 20% of the promotional budget toward referral incentives — with projected LTV improvement of 22% modeled across 10,000 simulated customer cohorts.
Each type fed the next. None of them alone would have been enough.
Which Type Does Your Business Actually Need?
Most organizations need all four — but at different stages of maturity. Here's a rough guide:
If you're just starting to make sense of your data, descriptive analytics is where to build your foundation. Get your reporting clean and consistent before doing anything fancier.
If you find yourself constantly reacting to problems without understanding their root causes, diagnostic analytics is your gap. Invest in data exploration capabilities.
If you're making major resource allocation decisions — inventory, hiring, marketing spend — predictive analytics can give you a meaningful edge over gut-feel decisions.
If you're operating at scale in a complex system with many moving parts (logistics, pricing, clinical decisions), prescriptive analytics is where transformational ROI lives. It's harder to implement, but the businesses doing it well — Amazon, UPS, major airlines — are doing it because it works.
The honest truth? Most companies overinvest in descriptive dashboards and underinvest in the higher-value layers. A beautiful Power BI report telling you what already happened isn't a strategy. But knowing what's likely coming and exactly what to do about it? That's a competitive advantage.
Citations:
1. UPS ORION System
- Source: UPS official newsroom
- URL: https://www.pressroom.ups.com/pressroom/ContentDetailsViewer.page?ConceptType=PressReleases&id=1426321563531-282
- Anchor text suggestion: "saves UPS an estimated 100 million miles driven per year"
2. Amazon Demand Forecasting / Inventory Prediction
- Source: Amazon Science blog
- URL: https://www.amazon.science/blog/a-new-method-to-improve-demand-forecasting-for-inventory-management
- Anchor text suggestion: "Amazon's demand forecasting"
3. Netflix Diagnostic Analytics / Viewership Behavior
- Source: Netflix Tech Blog
- URL: https://netflixtechblog.com/its-all-a-bout-testing-the-netflix-experimentation-platform-4e1ca458dc11
- Anchor text suggestion: "Netflix does this constantly"
Related: Erin Brockovich Targets Data Center Secrecy: What AI Developers Need to Know
AI Herald Analysis
This framework matters because most companies are still drowning in dashboards while starving for decisions. The real gap isn’t data volume—it’s that teams stop at descriptive analytics and mistake visibility for insight. For developers, the mandate is clear: build tools that don’t just prettify the past but actively guide the next move, embedding diagnostic and prescriptive logic into workflows. Businesses that skip straight to predictive models without nailing the “why” will keep chasing phantom trends, burning budget on forecasts built on sand.