Here's a question worth sitting with for a moment: if every company is drowning in data but most don't know what to do with it, who's the most valuable person in that building?
The data analyst. Every time.
You don't need a fancy computer science degree. You don't need to know machine learning or write code that looks like hieroglyphics. What you need is a clear roadmap, the right tools, and the discipline to actually follow through because most people who start this journey quit somewhere around month two when things get genuinely hard.
This guide won't let that happen to you.
This is the complete data analyst roadmap for 2026 — built for absolute beginners, structured around how hiring managers actually think, and honest about what's changed in the last couple of years (spoiler: AI has changed a lot). Whether you're a fresh graduate, a career switcher, or someone who's been circling this field for months without knowing where to start, this is your step-by-step path from zero to job-ready.
Is Becoming a Data Analyst Still Worth It in 2026?
Let's get this out of the way immediately, because you've probably seen the "AI is replacing analysts" headlines.
It's not. Not even close.
Data analytics remains one of the most reliable entry points into the broader data and AI ecosystem. However, the expectations from data analysts have evolved significantly. Companies no longer hire analysts just to generate reports or dashboards. They hire professionals who can understand business problems, work with imperfect data, collaborate with stakeholders, and use AI as a productivity advantage.
That's a key shift. AI handles the repetitive, mechanical parts of the job the basic cleaning, the boilerplate reports. What it can't do is ask the right question, understand why a number matters to the business, or walk into a room of non-technical people and explain what the data actually means. That's still entirely human work. And that's exactly what companies are paying for.
The money tells the same story. Data analyst salaries have increased by $20,000 since 2025, with the current average at $111,000, showing strong market demand and value for analytical skills. Entry-level positions now commonly start around $90,000 in the US. Demand is expected to outpace supply, with 11.5 million new data roles projected by late 2026, and approximately 108,400 new jobs for data analysts projected over the next decade.
And the Bureau of Labor Statistics? The BLS projects strong growth in analytics careers, including 34% growth for data scientists and 7% growth for market research analysts from 2024 to 2034.
So yes. It's worth it. Let's talk about how to get there.
What Does a Data Analyst Actually Do All Day?
Before mapping out the roadmap, you need to understand what you're actually training for. There's a lot of romanticized nonsense online about "uncovering hidden insights" and "transforming data into gold." Here's the more honest version.
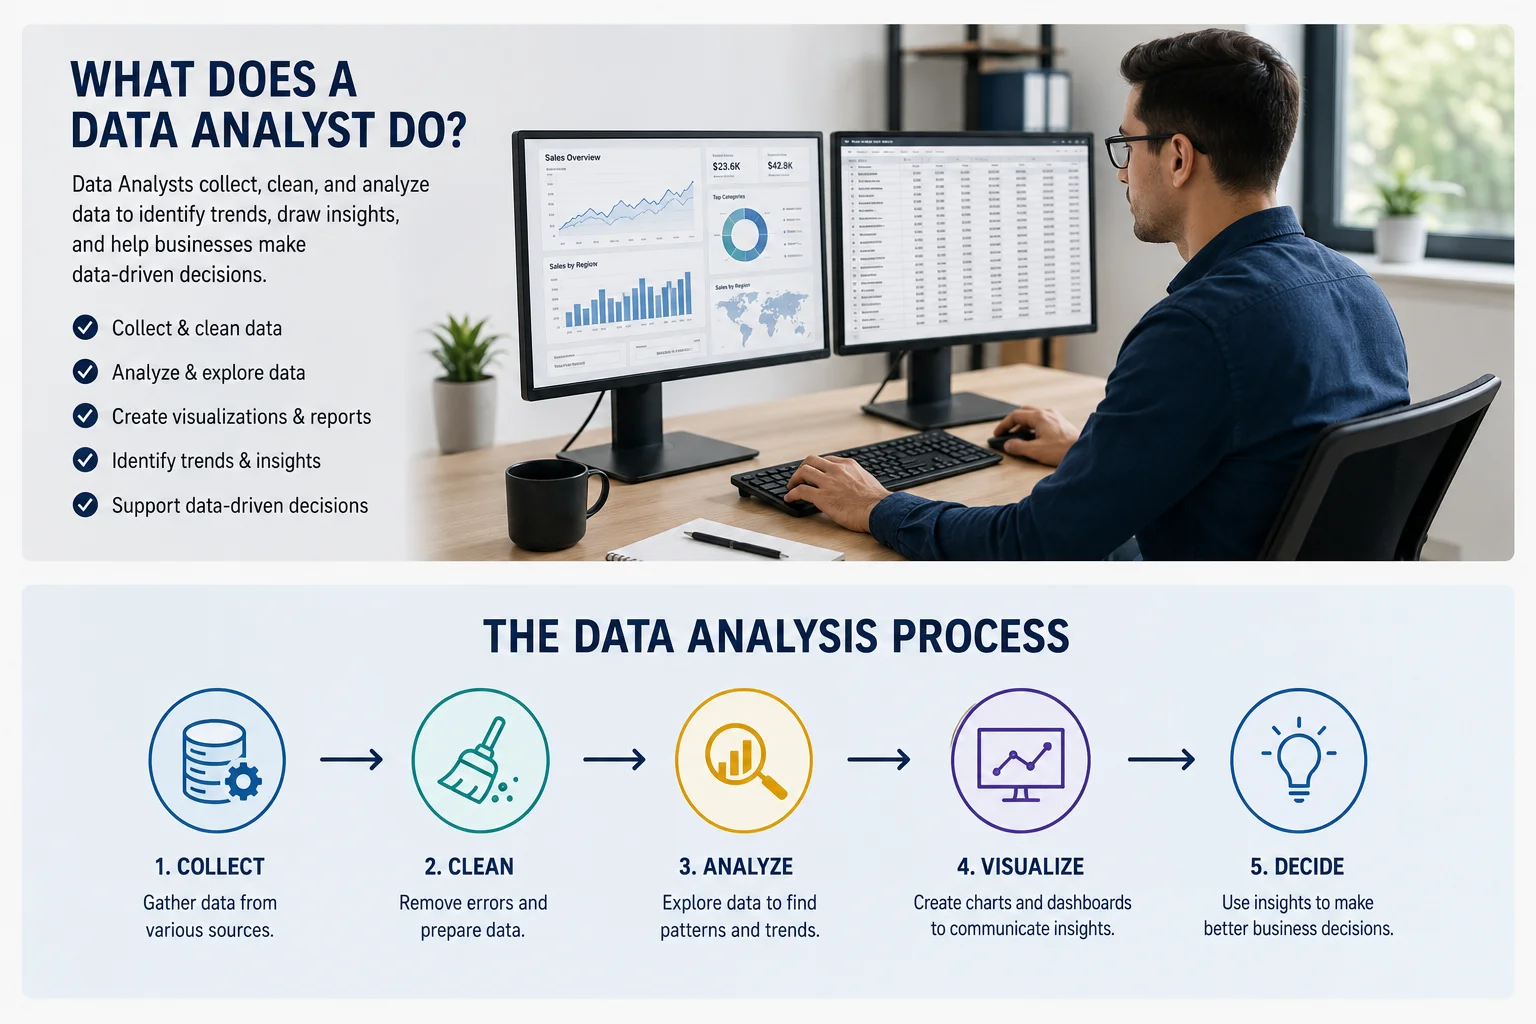
Data analysis involves collecting data from different data sources, cleaning data to remove errors, and then applying different techniques to find patterns and identify anomalies. Data analysts use tools like data visualization and techniques, such as creating charts with Power BI or Microsoft Excel, to present data in a way that helps stakeholders interpret it and make informed decisions.
About 40-60% of a real analyst's time is spent cleaning messy data. Nobody tells you that upfront. A spreadsheet comes in with inconsistent formatting, duplicate rows, missing values, and dates formatted three different ways across the same column. You fix it before you can analyze anything. That's the job.
The rest of your time goes to three things: pulling data from databases using SQL, building dashboards and reports in tools like Power BI or Tableau, and communicating what you found to people who don't care about the technical details — they just want to know what action to take.
Data analysts spend their days gathering requirements from business stakeholders, extracting and cleaning data using SQL and Python, building dashboards in Power BI or Tableau, and creating reports with Excel or Google Sheets.
That last part communicating to non-technical people — is the skill that separates analysts who get promoted from analysts who stay stuck at entry level forever. Technical skill gets you through the door. Communication skill determines how far you go.
The Data Analyst Career Path 2026: Role Types You Should Know
Before diving into the technical roadmap, understand that "data analyst" isn't one job. It's a family of jobs. Job demand appears fragmented because roles are advertised under different titles. Positions like Power BI Developer, MIS Executive, Marketing Analyst, or Finance Analyst often require the same analytics foundation.
Here's how to think about the main categories:
BI Reporting Analysts (MIS Roles) The most common entry-level path. You're building standard reports and dashboards in predefined formats. Heavy use of Excel and one BI tool. Very accessible for beginners with a solid portfolio.
Tool-Specific Analysts (Power BI Developer, Tableau Analyst) — You specialize deeply in one platform. Advanced dashboards, data modeling, performance optimization. Higher pay than basic MIS roles, and a strong portfolio can get you in here fresh.
Domain Analysts (Marketing, Finance, Healthcare, Supply Chain) — You combine analytics skills with real business knowledge in a specific field. This is where compensation gets seriously interesting and where most analysts eventually land for long-term career growth.
Product Analysts — Mostly at tech companies. You're working on user behavior, funnel analysis, retention, A/B tests. High demand in the startup and tech world.
Knowing which lane interests you shapes which skills you prioritize and which projects you build. Don't try to be everything at once.
The Complete Data Analyst Roadmap 2026: Step by Step
Here's the honest truth about how long this takes: if you study 1-2 hours consistently every day, you can complete this roadmap in roughly six months. The key word is consistently. Most people who start a data analytics journey quit during month two when things get harder.
Don't be most people.
Phase 1: Build Your Foundation (Weeks 1–4)
This is the part everyone wants to skip because it doesn't feel exciting. Do not skip it.
Start with Excel and Google Sheets, I know Excel is not exactly the sexiest tool in the world. But Microsoft Excel is referenced in 41.3% of job postings, emphasizing its continued importance for data analysis and reporting. That number doesn't lie. Every single company, regardless of size or industry, uses Excel. If you can't navigate it comfortably, you'll struggle in every real job.
What to learn in Excel:
- Formulas: VLOOKUP, INDEX/MATCH, IF statements, SUMIF, COUNTIF
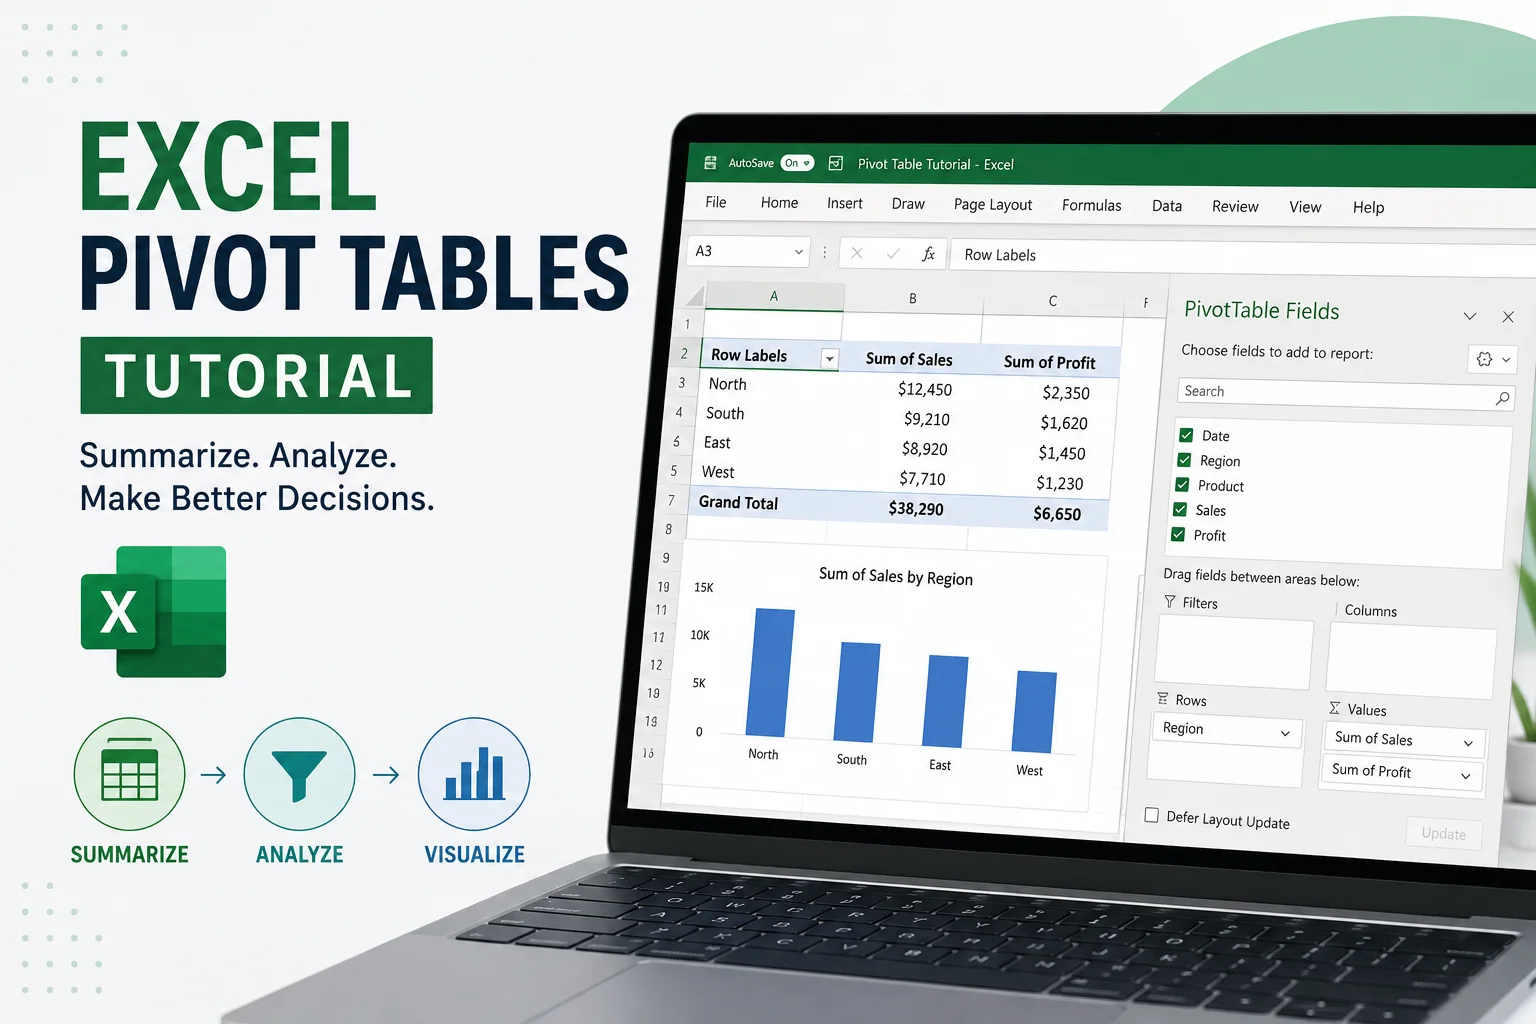
- Pivot tables (genuinely powerful once you get them)
- Basic charts and conditional formatting
- Data validation and cleaning techniques
Spend about two weeks on this. Don't just watch tutorials — download a real dataset from Kaggle and actually work with it in Excel. The difference between watching someone use a pivot table and building one yourself from scratch is enormous.
Learn Basic Statistics (the Practical Kind)
You don't need to become a statistician. Strengthen your basic statistics: mean, median, variance, correlation, and probability. You don't need to be a math genius — just understand how these concepts explain real-world data.
Here's what this looks like practically: if a company's average customer spends $50 per order but the median spend is $22, you should immediately know that a small number of high-spending customers are pulling the average up. That's the kind of interpretation that makes you valuable. That's statistics in action.
Focus on:
- Descriptive statistics (mean, median, mode, standard deviation)
- Distributions (normal, skewed)
- Correlation vs. causation (this one matters a lot for business conversations)
- Basic probability
- Hypothesis testing concepts (you don't need to be able to code it yet — just understand what it means)
Khan Academy and StatQuest on YouTube are genuinely excellent for this. Free, clear, and actually enjoyable.
Phase 2: Master SQL — Your Most Important Technical Skill (Weeks 5–10)
If there's one thing you take away from this entire guide, make it this: SQL is non-negotiable.
Nearly every company stores their data in relational databases, and SQL is how you talk to those databases. You'll use it to pull data, filter records, join tables, and build reports. In 2026, SQL remains the single most commonly tested skill in data analyst interviews — across industries, company sizes, and job levels.
SQL is used in day-to-day activities by every data analyst. Jobs in analytics have increased by 28% annually, and SQL knowledge is a prerequisite across essentially all of them.
When someone asks "should I learn Python or SQL first?" — the answer is SQL. Always SQL.
What SQL to Learn and In What Order
Week 5–6 (Beginner SQL):
- SELECT, FROM, WHERE
- ORDER BY, GROUP BY, HAVING
- Basic aggregate functions: COUNT, SUM, AVG, MIN, MAX
- INNER JOIN, LEFT JOIN, RIGHT JOIN
Week 7–8 (Intermediate SQL):
- Subqueries
- CASE WHEN statements
- String and date functions
- Multiple table joins
Week 9–10 (Advanced SQL):
- Window functions (ROW_NUMBER, RANK, LAG, LEAD) — these come up in almost every technical interview
- Common Table Expressions (CTEs)
- Query optimization basics
Where to practice: Mode Analytics, LeetCode (SQL section), HackerRank SQL, and SQLZoo are all excellent. Start with SQLZoo if you've never written a SQL query in your life — it's the most beginner-friendly. Move to LeetCode once you're comfortable with JOINs.
One practical exercise I'd recommend: find a public dataset (sales data, customer data, anything business-related) and write 20 different SQL queries against it. Not theoretical exercises actual questions you'd want answered. "What were the top 10 products by revenue last month?" "Which customers placed more than 3 orders?" Real questions build real intuition. Here are 4 types of data analytics you must.
Phase 3: Learn Python for Data Analysis (Weeks 11–16)
Python is where a lot of beginners get scared and quit. Don't.
You're not learning Python to become a software engineer. You're learning it to manipulate data faster than you can in Excel, automate repetitive tasks, and eventually do more sophisticated analysis. The bar is different, and it's much more achievable than you think.
Learning Python as a second tool, after SQL, is the right approach. Python ranks second in the majority of job descriptions for data analysts.
What Python to Learn (and What to Skip)
For data analysis specifically, focus on three libraries:
Pandas — This is your workhorse. It's how you load data, clean it, filter it, merge it, and reshape it. Think of it as Excel on steroids. The core operations — reading CSV files, filtering rows, grouping and aggregating, merging dataframes — cover about 80% of what you'll use Python for in a real analyst role.
NumPy — You'll use this mostly as a foundation under Pandas, but knowing basic NumPy array operations is useful. Don't over-invest here early on.
Matplotlib / Seaborn — For creating charts and visualizations directly in Python. Seaborn is more beginner-friendly and creates nicer-looking charts with less code.
What to skip early: machine learning libraries like scikit-learn. You can circle back to those later. Focus on getting comfortable analyzing data first.
A Real Python Learning Path
- Weeks 11–12: Python basics (variables, data types, loops, functions, lists, dictionaries). Use free courses on Codecademy or W3Schools for this. Two weeks max.
- Weeks 13–14: Pandas fundamentals. Read a CSV, clean missing values, filter data, group and aggregate, merge tables.
- Weeks 15–16: Apply Python to a real dataset end to end. Pick a Kaggle dataset, clean it in Pandas, answer 10 business questions, and visualize your findings with Seaborn.
The dataset exercise is the most important step. Theory without practice is just trivia.
Phase 4: Learn a BI Tool (Power BI or Tableau) (Weeks 17–22)
This is where things start looking like an actual analyst job. Dashboards. Interactive charts. Visual reports that business people actually open and use.
You need one BI tool. Not both — just one, done well.
Data visualization tools are a must — Tableau (28.1%) and Power BI (24.7%) are the most in-demand visualization tools in job postings.
So which one?
Choose Power BI if: you're targeting roles in corporate companies, finance, healthcare, or any industry where Microsoft products dominate. It integrates beautifully with Excel and the Microsoft ecosystem. It's also cheaper (free desktop version), which matters when you're learning.
Choose Tableau if: you're targeting tech companies, startups, or any role where design and visual quality matter more than Microsoft integration. Tableau makes it easier to create genuinely beautiful visualizations.
Honestly? Power BI is the safer bet for job-hunting across most industries. It's in more job descriptions, and the Microsoft ecosystem is everywhere.
What to Actually Build in Your BI Tool
Don't just watch tutorial videos. Build these specific things:
- A sales performance dashboard — revenue over time, top products, regional breakdown, month-over-month comparison
- A customer analysis dashboard — segmentation, retention rate, average order value
- A KPI summary dashboard — the kind an executive would open every Monday morning
Make them look good. Seriously. Ugly dashboards signal to interviewers that you don't care about the end user, which is a red flag for a job that's fundamentally about communicating with people.
For Power BI specifically: learn DAX (Data Analysis Expressions) — it's Power BI's formula language, similar in concept to Excel formulas but more powerful. Master the time intelligence functions (DATEADD, DATESYTD, PREVIOUSMONTH) because they come up in virtually every real dashboard.
Phase 5: Statistics and Analytical Thinking (Ongoing)
This isn't a "complete it in X weeks" phase — it's something you build alongside your technical skills.
Most data analyst courses teach you how to use tools. Very few teach you what to do with them. The gap between a junior analyst who can run queries and a senior analyst who can actually drive decisions is almost entirely statistical and analytical thinking.
What to develop here:
A/B Testing and Experimentation — Understand statistical significance, p-values, and confidence intervals. Know when a difference in numbers is real vs. noise. This comes up constantly, especially in product analytics and marketing analytics.
Cohort Analysis — Group users by when they started, then track how their behavior changes over time. It's the core of retention analysis at every tech company.
Time Series Thinking — Understand trends, seasonality, and how to detect anomalies. If sales drop 20% in November, is that a problem or is that seasonal? These are the questions that matter.
Regression Basics — You don't need to implement it from scratch, but understanding what a regression tells you and what its limitations are makes you a dramatically better analyst.
The book Naked Statistics by Charles Wheelan is one of the best investments you can make at this stage. It explains statistical concepts through real-world stories, with no math heavy lifting required.
Phase 6: AI Tools for Analysts (Don't Skip This) (Weeks 20–24)
This is new to the roadmap. And it matters more than most guides acknowledge.
By 2026, tools like Microsoft Copilot for Power BI, Tableau's Einstein AI features, and AI-assisted SQL generation have become mainstream. Analysts who know how to use these tools effectively — not just blindly, but with a critical eye — work significantly faster and take on more complex projects. This is an emerging skill that not many people list on their resumes yet, which makes it a real differentiator.
Think of AI tools as a multiplier, not a replacement. A junior analyst who knows how to use Claude or ChatGPT effectively can clean data faster, debug SQL errors in seconds instead of minutes, generate first drafts of dashboards, and produce written summaries of their findings that would have taken an hour to write manually.
The critical skill here is knowing when to trust AI output and when to check it. AI-generated SQL can be wrong. AI-generated insights can miss business context. You need the foundational knowledge from phases 1-5 to audit what AI produces — that's what separates someone who uses AI productively from someone who just copies and pastes wrong answers.
Practical ways to use AI in your workflow:
- Debugging SQL: paste your query and error message into Claude, explain what you're trying to do
- Data storytelling: draft your analysis findings, then ask AI to help sharpen the language for a non-technical audience
- Learning: when you don't understand a concept, ask for a clear explanation with a specific example
- Code writing: generate starter Python code, then read and modify it yourself rather than treating it as a black box
Phase 7: Build a Portfolio That Gets You Hired (Weeks 22–26)
Here's the uncomfortable truth: your certificate means almost nothing to a hiring manager compared to real project work. Many candidates struggle not because the field is inaccessible, but because they rely solely on tutorials and certificates. In analytics, practice and demonstrable thinking matter far more than passive consumption.
Recruiters spend 30 seconds reviewing portfolios. Make yours unskippable with 5 projects that demonstrate end-to-end skills.
What Makes a Portfolio Project Actually Good
A good portfolio project isn't about the dataset or the tool. It's about demonstrating how you think. Every project should show three things:
- A clear business question — not "I analyzed sales data" but "I investigated why customer churn increased 18% in Q3 and identified the three leading indicators."
- A clean analytical process — data cleaning documented, methodology explained, findings clearly shown
- Actionable conclusions — what should the business do based on what you found?
A messy dataset with a clear, well-communicated insight is worth 10 times more than a clean dataset with a bland "here's a dashboard."
Five Portfolio Projects to Build
Project 1: Sales Analysis Dashboard Use publicly available e-commerce or retail data. Build a Power BI or Tableau dashboard showing revenue trends, top-performing products, regional performance, and year-over-year comparisons. Focus on making it interactive and genuinely useful — not just pretty.
Project 2: Customer Churn Analysis Use a telecom or SaaS dataset (both are easy to find on Kaggle). Your goal: identify which customers are most likely to churn and why. Use SQL for data extraction, Python for analysis, and visualize your findings. Write a 1-page summary of your recommendation as if you're presenting to a VP of Marketing.
Project 3: SQL Business Questions Pick a dataset with at least 5 tables (order data, customer data, product data, etc.). Write 15-20 SQL queries that answer real business questions. Publish these on GitHub with clear explanations of what each query answers and why it matters.
Project 4: A/B Test Analysis Use public A/B test data (Kaggle has several). Walk through the entire process — setting up the test, checking statistical significance, interpreting the results, and making a business recommendation. This one stands out because so few beginners tackle it.
Project 5: Domain-Specific Project Pick your target industry and build something relevant. Marketing? Analyze a digital ad campaign's performance. Finance? Build a budget vs. actuals tracker with variance analysis. Healthcare? Analyze hospital readmission rates. Domain relevance signals to interviewers that you've thought about the job beyond just "I know the tools."
Put these on GitHub. Write a clear README for every project. Link to them on your LinkedIn profile and resume. That's your portfolio.
Phase 8: Get Job-Ready (Weeks 24–28)
Technical skills get your resume seen. Interview skills get you hired.
What Interviewers Actually Test
Most data analyst interviews have three components:
1. SQL Test — Almost universal. You'll be given a schema and asked to write queries on the spot. The most common patterns: aggregations with GROUP BY, multi-table JOINs, window functions (especially rank and running totals), and filtering with complex WHERE conditions. LeetCode SQL and Mode Analytics Practice Problems are your best prep.
2. Case Study / Business Problem — You're given a vague business scenario ("Our conversion rate dropped 15% last month, how would you investigate?") and asked to walk through your thinking. There's no single right answer — they're evaluating your structured thinking, the questions you ask, and whether you think like a business person or a pure technician.
3. Tool Demonstration — Sometimes you're asked to build or explain a dashboard, write Python to clean a dataset, or walk through an Excel model. Have your portfolio projects fresh in your mind to reference.
The Resume Reality
84.9% of employers don't specify the required experience in job postings, suggesting they put more value on the skills of the applicants. This means if you have a strong portfolio and the right technical skills, the absence of years of experience matters less than you'd think. Your resume should lead with your skills and projects, not your job history.
List your tools explicitly: SQL, Python (Pandas, NumPy), Power BI / Tableau, Excel. Quantify every bullet point where possible. "Built a dashboard tracking $2M in monthly revenue across 5 product lines" reads infinitely better than "built dashboards."
Skills by Priority: What to Learn First vs. What Can Wait
Here's a ranked breakdown based on how often skills appear in job postings and how foundational they are:
Must-Have (Learn First):
- SQL — appears in 70%+ of job postings; foundational to everything
- Excel — referenced in 41.3% of postings; still the business world's default tool
- Power BI or Tableau — 24-28% of postings; this is how you deliver your work
- Data cleaning and wrangling — the most time-consuming part of real analyst work
High Value (Learn Second):
- Python (Pandas) — increasingly expected, especially at mid-level roles
- Basic statistics — without this, your analysis can't be trusted
- Data storytelling and communication — the multiplier on all your technical skills
Good to Have (Learn After You're Job-Ready):
- Cloud basics (AWS or Azure) — relevant for more senior roles
- Git and version control — good practice for collaborative environments
- Advanced Python (NumPy, Matplotlib, Seaborn)
- Basic machine learning concepts
Nice to Know (Not Required to Start):
- Spark or big data tools
- Deep learning
- R (Python is a better investment of your time)
Certifications Worth Your Time
Certifications don't replace portfolio projects. But they do add credibility and structure to your learning. Here are the ones worth pursuing, in order of value:
Google Data Analytics Certificate (Coursera) — The most recognized entry-level certification. Covers SQL, R, and Tableau. Takes about 6 months part-time. Highly recommended as a structured starting point, though you'll want to supplement with Power BI given its dominance in the job market.
Microsoft PL-300 (Power BI Data Analyst Associate) — If you're focusing on Power BI, this is the certification to get. Microsoft certifications carry real weight in corporate hiring. Moderate difficulty, very practical.
IBM Data Analyst Professional Certificate (Coursera) — Good alternative to Google's certificate. Covers Python and SQL with hands-on labs.
Tableau Desktop Specialist — Worth it if you're going the Tableau route. Not as universally recognized as the Microsoft cert, but still adds value.
What not to bother with: Generic "Big Data" or "Machine Learning" certificates from random platforms before you have the fundamentals down. They look impressive on paper and teach you almost nothing practical.
The Honest Truth About How Long This Takes
Six months. That's the real answer for most people studying 1-2 hours daily.
Here's roughly how that breaks down:
- Months 1–2: Excel, statistics, and SQL fundamentals
- Month 3: Intermediate to advanced SQL + starting Python
- Month 4: Python for data analysis + beginning your BI tool
- Month 5: Completing your BI tool skills + building your first two portfolio projects
- Month 6: Finishing your portfolio, prepping for interviews, applying
The candidates who fail and a lot do make one of three mistakes. They spend too long on tutorials without building anything. They try to learn everything at once. Or they quit in month two when SQL window functions break their brain for the third day in a row.
Build something. Every week. No exceptions.
Data Analyst Career Path: What Comes After Your First Job
Getting your first role is the beginning, not the finish line. Here's what the typical progression looks like:
The career path goes from Junior Data Analyst (0-2 years), focused on SQL, Excel, and basic dashboards, to Data Analyst (2-4 years) with advanced DAX/Python and stakeholder management, to Senior Data Analyst (4-7 years) with team leadership, complex projects, and automation.
At the Senior level, you're not just doing more analysis — you're shaping what questions get asked. You're sitting in strategy meetings. You're managing junior analysts. That jump requires something beyond technical skill: the ability to think like a business owner.
From there, the paths diverge. Some analysts move toward Analytics Engineering (higher pay, cleaner data infrastructure work). Some move toward Data Science (more math, ML modeling, average US salary around $129,000). Some move toward Analytics Management (people leadership, strategy). There's no single right path — it depends on where your curiosity takes you.
The analysts who get stuck are usually the ones who get very good at their tools but never develop the business judgment to go with it. Don't be that person.
Common Questions, Answered Honestly
Do I need a degree to become a data analyst?
No. A high number of working analysts didn't even study data science formally. In 6-12 months, bootcamps, self-paced courses, and regular practice can get you job-ready. You'll have to become obsessive about your portfolio and certifications, since hiring managers actively look at these factors.
That said — if you have a degree in any quantitative field (economics, engineering, math, even psychology with stats), it helps. Not because the degree teaches you analyst skills, but because it signals the ability to learn complex material.
Python or SQL first?
SQL first. Always. SQL is needed in almost all analyst positions. Python is an excellent programming language that ranks second in the majority of job descriptions.
Will AI replace data analysts?
AI has not killed analysts — it has multiplied their efforts. Companies require humans to pose the correct questions and make meaning out of AI-produced insights. The analysts at risk are the ones who only do mechanical work — basic report generation, rote data pulling. The analysts who ask better questions and communicate insights clearly are more valuable than ever.
How much can I realistically earn starting out?
In the US, most career changers land their first data analyst job between $65,000 and $80,000, with clear paths to $100,000+ by year three. If you're based in a major tech or financial hub, your earning potential is likely higher than average — the median salary for a mid-level analyst in Seattle is $81,600, roughly 29% above the national midpoint.
Which industry pays best?
Tech and finance consistently pay 15-25% premiums over other industries for the same title and experience level. Healthcare is the fastest growing in terms of hiring volume. If pure income is your goal, target tech companies or financial services.
Where to Actually Learn (Free and Paid Resources)
Here's a curated list — not an exhaustive one, because more resources isn't the problem. Focus is.
For SQL:
- SQLBolt — best free beginner resource, period
- Mode Analytics SQL Tutorial — intermediate level, great exercises
- LeetCode SQL problems — best for interview prep
For Python:
- Python for Everybody (Coursera) — Dr. Chuck's course is legendary for beginners
- Kaggle's Free Python and Pandas Courses — practical, concise, excellent
For Statistics:
- StatQuest with Josh Starmer (YouTube) — clearest explanations on the internet
- Naked Statistics by Charles Wheelan — read this alongside your technical courses
For BI Tools:
- Microsoft's own Power BI learning path (free, official, comprehensive)
- Tableau Public Gallery — study how others build and reverse-engineer the best ones
For Datasets to Practice On:
- Kaggle Datasets — thousands of free datasets across every domain
- Google Dataset Search — find government and research datasets
- Maven Analytics Data Playground — curated business datasets ideal for portfolio projects
Your First 30 Days: A Concrete Action Plan
Knowing the full six-month roadmap is valuable. But people who start with "I'll begin properly next week" rarely do. Here's exactly what to do in your first 30 days:
Days 1–7: Download Excel, find a free sales dataset on Kaggle, and build your first pivot table. Learn VLOOKUP. Don't move on until you're comfortable filtering, sorting, and summarizing data in Excel. Watch the ExcelJet YouTube channel.
Days 8–14: Create a free account on SQLBolt. Complete all 19 lessons. Don't rush — actually understand what each clause does and why. Write your own practice queries on a second dataset.
Days 15–21: Download the free Power BI Desktop. Find a tutorial dataset and build your first dashboard with at least 5 visualizations. Make it look clean. Share a screenshot on LinkedIn.
Days 22–30: Write three SQL queries that answer real business questions from a dataset of your choice. Publish them on GitHub with explanations. Set up your GitHub profile. This is the beginning of your public portfolio.
That's it. Not complicated. Not expensive. Just consistent.
Final Thoughts
The data analyst roadmap for 2026 is clear. The tools are well-defined. The job market is strong. The path from beginner to employed analyst, while not easy, is more structured and accessible than almost any other tech career you could pursue.
What separates people who make it from people who don't isn't talent. It's consistency and intellectual honesty. The ones who succeed are the ones who build things when they'd rather watch a tutorial, who look up concepts they don't understand instead of skipping past them, and who keep going in month three when it feels like they haven't learned anything.
If you're reading this and you're on the fence start today. Not tomorrow. Open SQLBolt in a new tab right now and do the first three lessons. That's all. Build the momentum before your brain has time to negotiate.
The data is waiting. Go analyze it.
Sources:
roadmap.sh/data-analyst Community data analyst roadmap
365 Data Science: Data Analyst Job Outlook 2026
Codebasics: Data Analyst Roadmap 2026
Bureau of Labor Statistics: Operations Research Analysts
Glassdoor Data Analyst Salary Data
Analytics Vidhya: Data Analyst Learning Path
Related: Fine-Tune a Small LLM on Your Own Data in 2026: A Step-by-Step Guide
AI Herald Analysis
This is the real story the article touches but doesn't fully land: the data analyst role is finally being stripped of its grunt work, which is terrifying for the mediocre and a goldmine for the sharp. For developers, the implication is brutal—spending your time mastering SQL joins or perfecting Tableau dashboards is a career dead end; AI does that now. For businesses, the value has shifted from "who can build the chart" to "who can ask the right question and sell the answer to a skeptical VP." The AI industry should be nervous too, because this evolution proves that domain intuition and stakeholder politics are the last moats, and no amount of fine-tuning will replace someone who knows why a metric actually matters.